


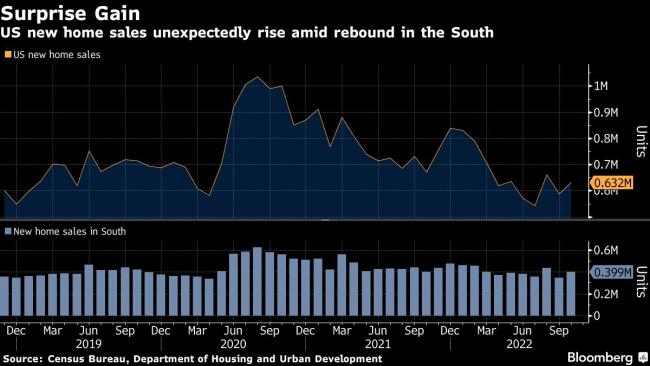
(Bloomberg) -- Sales of new US homes unexpectedly rose in October, largely driven by an increase in the South and likely representing a pause in an otherwise weak housing market.
Purchases of new single-family homes increased 7.5% to an annualized 632,000 pace last month after falling in September, government data showed Wednesday. The median estimate in a Bloomberg survey of economists called for a 570,000 rate.
Sales in the South rebounded after a sharp retreat a month earlier when Hurricane Ian slammed into Florida and parts of Georgia and South Carolina. The October pace in the South was still slower than in August.
Even with the surprising pickup in sales, buyer demand has rapidly evaporated this year amid the Federal Reserve’s aggressive interest rate hikes to tame inflation. Mortgage rates, which topped 7% by the end of October, have more than doubled this year. That’s put a brake on sales and construction while also helping to push down home prices.
Looking ahead, though, a recent drop in mortgage rates may help to stabilize housing demand. The 30-year fixed mortgage rate has dropped nearly a half percentage point in the past two weeks, the most since 2008 according to Mortgage Bankers Association data released Wednesday.
In addition to the 16% sales pickup in the South, demand in the Northeast also increased. Purchases in the Midwest and West fell.
The report, produced by the Census Bureau and the Department of Housing and Urban Development, showed the median sales price of a new home rose 15.4% from a year earlier, to $493,000.
For Sale
There were 470,000 new homes for sale as of the end of last month, though the overwhelming majority remain under construction or not yet started. The number of for-sale dwellings under construction, however, was the smallest in six months. At the current sales pace, it would take 8.9 months to exhaust the supply of new homes.
Earlier this month, Michael Murray, co-chief operating officer at D.R. Horton Inc., one of the largest US homebuilders, said the company closed fewer homes than expected in the latest quarter due to slower sales, more cancellations and continued construction delays.
New single-family home construction declined in October to the slowest pace since May 2020, according to government data last week. Permits also declined, and homebuilder sentiment has declined every month this year.
The number of homes sold in October and awaiting the start of construction -- a measure of backlogs -- increased to the highest level since January.
New-home purchases account for about 10% of the market and are calculated when contracts are signed. They are considered a timelier barometer than purchases of previously-owned homes, which are calculated when contracts close.
The new-homes data are volatile; the report showed 90% confidence that the change in sales ranged from a 13.3% decline to a 28.3% increase.


EUR/USD
1.0658
-0.0008 (-0.07%)
Summary
↑ SellMoving Avg:
Buy (0)
Sell (12)
Indicators:
Buy (2)
Sell (3)
EUR/USD
1.0658
-0.0008 (-0.07%)
Summary
↑ SellMoving Avg:
Buy (0)
Sell (12)
Indicators:
Buy (2)
Sell (3)
GBP/USD
1.2475
-0.0015 (-0.12%)
Summary
↑ SellMoving Avg:
Buy (0)
Sell (12)
Indicators:
Buy (0)
Sell (10)
USD/JPY
157.91
+0.12 (+0.07%)
Summary
↑ BuyMoving Avg:
Buy (12)
Sell (0)
Indicators:
Buy (9)
Sell (0)
AUD/USD
0.6469
-0.0003 (-0.05%)
Summary
NeutralMoving Avg:
Buy (10)
Sell (2)
Indicators:
Buy (2)
Sell (3)
USD/CAD
1.3780
+0.0003 (+0.03%)
Summary
↑ BuyMoving Avg:
Buy (12)
Sell (0)
Indicators:
Buy (7)
Sell (0)
EUR/JPY
168.32
+0.10 (+0.06%)
Summary
↑ BuyMoving Avg:
Buy (12)
Sell (0)
Indicators:
Buy (9)
Sell (0)
EUR/CHF
0.9808
+0.0001 (+0.01%)
Summary
NeutralMoving Avg:
Buy (0)
Sell (12)
Indicators:
Buy (3)
Sell (2)
Gold Futures
2,295.80
-7.10 (-0.31%)
Summary
↑ SellMoving Avg:
Buy (0)
Sell (12)
Indicators:
Buy (0)
Sell (9)
Silver Futures
26.677
+0.023 (+0.09%)
Summary
↑ SellMoving Avg:
Buy (2)
Sell (10)
Indicators:
Buy (0)
Sell (9)
Copper Futures
4.5305
-0.0105 (-0.23%)
Summary
↑ BuyMoving Avg:
Buy (10)
Sell (2)
Indicators:
Buy (8)
Sell (1)
Crude Oil WTI Futures
81.14
-0.79 (-0.96%)
Summary
↑ SellMoving Avg:
Buy (0)
Sell (12)
Indicators:
Buy (1)
Sell (7)
Brent Oil Futures
85.62
-0.71 (-0.82%)
Summary
↑ SellMoving Avg:
Buy (1)
Sell (11)
Indicators:
Buy (1)
Sell (7)
Natural Gas Futures
1.946
-0.009 (-0.46%)
Summary
↑ SellMoving Avg:
Buy (0)
Sell (12)
Indicators:
Buy (0)
Sell (5)
US Coffee C Futures
213.73
-13.77 (-6.05%)
Summary
↑ SellMoving Avg:
Buy (3)
Sell (9)
Indicators:
Buy (0)
Sell (10)
Euro Stoxx 50
4,920.55
-60.54 (-1.22%)
Summary
↑ SellMoving Avg:
Buy (4)
Sell (8)
Indicators:
Buy (1)
Sell (7)
S&P 500
5,035.69
-80.48 (-1.57%)
Summary
↑ SellMoving Avg:
Buy (0)
Sell (12)
Indicators:
Buy (0)
Sell (7)
DAX
17,921.95
-196.37 (-1.08%)
Summary
↑ SellMoving Avg:
Buy (0)
Sell (12)
Indicators:
Buy (1)
Sell (6)
FTSE 100
8,144.13
-2.90 (-0.04%)
Summary
SellMoving Avg:
Buy (5)
Sell (7)
Indicators:
Buy (2)
Sell (4)
Hang Seng
17,763.03
+16.12 (+0.09%)
Summary
↑ SellMoving Avg:
Buy (0)
Sell (12)
Indicators:
Buy (1)
Sell (6)
US Small Cap 2000
1,973.05
-42.98 (-2.13%)
Summary
↑ SellMoving Avg:
Buy (0)
Sell (12)
Indicators:
Buy (0)
Sell (7)
IBEX 35
10,854.40
-246.40 (-2.22%)
Summary
NeutralMoving Avg:
Buy (6)
Sell (6)
Indicators:
Buy (3)
Sell (3)
BASF SE NA O.N.
49.155
+0.100 (+0.20%)
Summary
↑ SellMoving Avg:
Buy (0)
Sell (12)
Indicators:
Buy (1)
Sell (7)
Bayer AG NA
27.35
-0.24 (-0.87%)
Summary
↑ SellMoving Avg:
Buy (0)
Sell (12)
Indicators:
Buy (0)
Sell (8)
Allianz SE VNA O.N.
266.60
+0.30 (+0.11%)
Summary
↑ SellMoving Avg:
Buy (0)
Sell (12)
Indicators:
Buy (3)
Sell (5)
Adidas AG
226.40
-5.90 (-2.54%)
Summary
↑ SellMoving Avg:
Buy (0)
Sell (12)
Indicators:
Buy (2)
Sell (7)
Deutsche Lufthansa AG
6.714
-0.028 (-0.42%)
Summary
NeutralMoving Avg:
Buy (3)
Sell (9)
Indicators:
Buy (9)
Sell (1)
Siemens AG Class N
175.90
-1.74 (-0.98%)
Summary
↑ SellMoving Avg:
Buy (0)
Sell (12)
Indicators:
Buy (0)
Sell (9)
Deutsche Bank AG
15.010
-0.094 (-0.62%)
Summary
NeutralMoving Avg:
Buy (4)
Sell (8)
Indicators:
Buy (6)
Sell (2)
| EUR/USD | 1.0658 | ↑ Sell | |||
| GBP/USD | 1.2475 | ↑ Sell | |||
| USD/JPY | 157.91 | ↑ Buy | |||
| AUD/USD | 0.6469 | Neutral | |||
| USD/CAD | 1.3780 | ↑ Buy | |||
| EUR/JPY | 168.32 | ↑ Buy | |||
| EUR/CHF | 0.9808 | Neutral |
| Gold | 2,295.80 | ↑ Sell | |||
| Silver | 26.677 | ↑ Sell | |||
| Copper | 4.5305 | ↑ Buy | |||
| Crude Oil WTI | 81.14 | ↑ Sell | |||
| Brent Oil | 85.62 | ↑ Sell | |||
| Natural Gas | 1.946 | ↑ Sell | |||
| US Coffee C | 213.73 | ↑ Sell |
| Euro Stoxx 50 | 4,920.55 | ↑ Sell | |||
| S&P 500 | 5,035.69 | ↑ Sell | |||
| DAX | 17,921.95 | ↑ Sell | |||
| FTSE 100 | 8,144.13 | Sell | |||
| Hang Seng | 17,763.03 | ↑ Sell | |||
| Small Cap 2000 | 1,973.05 | ↑ Sell | |||
| IBEX 35 | 10,854.40 | Neutral |
| BASF | 49.155 | ↑ Sell | |||
| Bayer | 27.35 | ↑ Sell | |||
| Allianz | 266.60 | ↑ Sell | |||
| Adidas | 226.40 | ↑ Sell | |||
| Lufthansa | 6.714 | Neutral | |||
| Siemens AG | 175.90 | ↑ Sell | |||
| Deutsche Bank AG | 15.010 | Neutral |
| Mua/Bán 1 chỉ SJC # So hôm qua # Chênh TG | |
|---|---|
| SJC Eximbank | 8,300/ 8,500 (8,300/ 8,500) # 1,298 |
| SJC 1L, 10L, 1KG | 8,300/ 8,520 (0/ 0) # 1,510 |
| SJC 1c, 2c, 5c | 7,380/ 7,550 (0/ 0) # 540 |
| SJC 0,5c | 7,380/ 7,560 (0/ 0) # 550 |
| SJC 99,99% | 7,370/ 7,470 (0/ 0) # 460 |
| SJC 99% | 7,196/ 7,396 (0/ 0) # 386 |
| Cập nhật 01-05-2024 10:45:19 | |
| Xem lịch sử giá vàng SJC: nhấn đây! | |
| ↀ Giá vàng thế giới | ||
|---|---|---|
| $2,285.72 | -47.5 | -2.04% |
| ʘ Giá bán lẻ xăng dầu | ||
|---|---|---|
| Sản phẩm | Vùng 1 | Vùng 2 |
| RON 95-V | 25.440 | 25.940 |
| RON 95-III | 24.910 | 25.400 |
| E5 RON 92-II | 23.910 | 24.380 |
| DO 0.05S | 20.710 | 21.120 |
| DO 0,001S-V | 21.320 | 21.740 |
| Dầu hỏa 2-K | 20.680 | 21.090 |
| ↂ Giá dầu thô thế giới | |||
|---|---|---|---|
| WTI | $80.83 | +3.39 | 0.04% |
| Brent | $85.50 | +3.86 | 0.05% |
| $ Tỷ giá Vietcombank | ||
|---|---|---|
| Ngoại tệ | Mua vào | Bán ra |
| USD | 25.088,00 | 25.458,00 |
| EUR | 26.475,36 | 27.949,19 |
| GBP | 30.873,52 | 32.211,36 |
| JPY | 156,74 | 166,02 |
| KRW | 15,92 | 19,31 |
| Cập nhật lúc 10:45:15 01/05/2024 Xem bảng tỷ giá hối đoái | ||

