


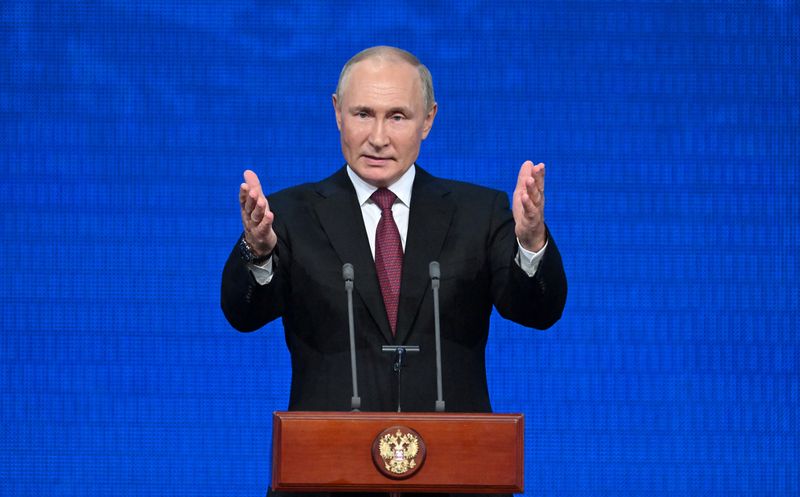
 © Reuters. FILE PHOTO: Russian President Vladimir Putin delivers a speech during an event marking the 100th foundation anniversary of the republics of Adygea, Kabardino-Balkaria and Karachay-Cherkessia in Moscow, Russia, September 20, 2022. Sputnik/Grigory Sysoev/Po
By Dhara Ranasinghe and John O'Donnell
LONDON (Reuters) - Earlier this year, markets were complacent as Russia massed troops on the Ukraine border. Now, they're once again largely shrugging off Vladimir Putin's signal that he could be prepared to use nuclear weapons.
World shares weathered an early knock to risk appetite on Wednesday after Putin mobilised more troops for Ukraine and threatened to use all of Russia's arsenal against what he called the West's "nuclear blackmail" over the war there.
It was Russia's first such mobilisation since World War Two and signified a major escalation of the war, now in its seventh month.
And while safe-haven assets such as the dollar, which hit a two-decade high against other major currencies, and government bonds in Germany and the United States rallied, stock markets appeared not to be too disturbed.
European stocks pared earlier falls and mostly rose, while the main indexes on Wall Street -- already bracing for another aggressive hike in U.S. interest rates later in the day -- opened higher on Wednesday.
"Back in January and February when Russian troops were mobilised, market participants wrongly interpreted it as a bluff to increase Putin's negotiating leverage, but then Putin exceeded expectations by going for a full invasion of Ukraine," said Tina Fordham, an independent geopolitical strategist and founder of Fordham Global Foresight.
"The most significant aspect of what markets are not pricing in now is the potential for Russia to use an unconventional weapon, meaning a tactical chemical or a nuclear weapon," she adding, noting that Putin had made some menacing remarks to this effect about the "wind blowing".
Fordham said that while Putin would likely stop short of a full blown unconventional attack, it was very much in his "playbook" to cause maximum instability.
GRAPHIC: The costs of war https://fingfx.thomsonreuters.com/gfx/mkt/mopanegwqva/Pasted%20image%201663766215154.png
The MSCI World Stock Index is down 21% this year and Europe STOXX 600 index has lost 16% -- both are poised for their worst year since 2008, when the global financial crisis unfolded.Russia's invasion of Ukraine, initially perceived as an outlier event, has dealt an extra blow to world markets that are still adjusting to a period of decades-high inflation and a sharp rise in borrowing costs from the likes of the Federal Reserve and European Central Bank.
Europe in particular has suffered, as Russia has choked off gas supplies, driving energy prices up in a squeeze on consumers and companies that has raised the risk of recession.
Germany's and Italy's reliance on Russia has made their stock markets among the world's worst performers this year. Those close to the fighting, including Poland and Hungary, have also seen their local markets pummeled. Investors have ditched the bonds of countries with high gas or wheat import bills too.
GRAPHIC: Stocks hit hardest by Russia-Ukraine war https://fingfx.thomsonreuters.com/gfx/mkt/xmpjoambkvr/Pasted%20image%201663765874819.png
Chris Weafer, chief executive of Macro-Advisory, a consultancy that advises companies on doing business in Russia, said Moscow was preparing for a long conflict, including continued throttling of energy supplies, and that it could better afford the confrontation than Europe.
"There had been a sense in Europe that Russia would look for a compromise. Today’s announcement makes it clear that is incorrect," he said. "Russia is digging in for the long haul. They are prepared to tough it out."
Arne Petimezas, a senior analyst at AFS Group in the Netherlands, said Putin was being underestimated.
"He has escalated every time. For him, it is life and death. I don't see why his next move will be de-escalation unless he wins," Petimezas said.


EUR/USD
1.0658
-0.0008 (-0.07%)
Summary
↑ SellMoving Avg:
Buy (0)
Sell (12)
Indicators:
Buy (2)
Sell (3)
EUR/USD
1.0658
-0.0008 (-0.07%)
Summary
↑ SellMoving Avg:
Buy (0)
Sell (12)
Indicators:
Buy (2)
Sell (3)
GBP/USD
1.2475
-0.0015 (-0.12%)
Summary
↑ SellMoving Avg:
Buy (0)
Sell (12)
Indicators:
Buy (0)
Sell (10)
USD/JPY
157.91
+0.12 (+0.07%)
Summary
↑ BuyMoving Avg:
Buy (12)
Sell (0)
Indicators:
Buy (9)
Sell (0)
AUD/USD
0.6469
-0.0003 (-0.05%)
Summary
NeutralMoving Avg:
Buy (10)
Sell (2)
Indicators:
Buy (2)
Sell (3)
USD/CAD
1.3780
+0.0003 (+0.03%)
Summary
↑ BuyMoving Avg:
Buy (12)
Sell (0)
Indicators:
Buy (7)
Sell (0)
EUR/JPY
168.32
+0.10 (+0.06%)
Summary
↑ BuyMoving Avg:
Buy (12)
Sell (0)
Indicators:
Buy (9)
Sell (0)
EUR/CHF
0.9808
+0.0001 (+0.01%)
Summary
NeutralMoving Avg:
Buy (0)
Sell (12)
Indicators:
Buy (3)
Sell (2)
Gold Futures
2,295.80
-7.10 (-0.31%)
Summary
↑ SellMoving Avg:
Buy (0)
Sell (12)
Indicators:
Buy (0)
Sell (9)
Silver Futures
26.677
+0.023 (+0.09%)
Summary
↑ SellMoving Avg:
Buy (2)
Sell (10)
Indicators:
Buy (0)
Sell (9)
Copper Futures
4.5305
-0.0105 (-0.23%)
Summary
↑ BuyMoving Avg:
Buy (10)
Sell (2)
Indicators:
Buy (8)
Sell (1)
Crude Oil WTI Futures
81.14
-0.79 (-0.96%)
Summary
↑ SellMoving Avg:
Buy (0)
Sell (12)
Indicators:
Buy (1)
Sell (7)
Brent Oil Futures
85.62
-0.71 (-0.82%)
Summary
↑ SellMoving Avg:
Buy (1)
Sell (11)
Indicators:
Buy (1)
Sell (7)
Natural Gas Futures
1.946
-0.009 (-0.46%)
Summary
↑ SellMoving Avg:
Buy (0)
Sell (12)
Indicators:
Buy (0)
Sell (5)
US Coffee C Futures
213.73
-13.77 (-6.05%)
Summary
↑ SellMoving Avg:
Buy (3)
Sell (9)
Indicators:
Buy (0)
Sell (10)
Euro Stoxx 50
4,920.55
-60.54 (-1.22%)
Summary
↑ SellMoving Avg:
Buy (4)
Sell (8)
Indicators:
Buy (1)
Sell (7)
S&P 500
5,035.69
-80.48 (-1.57%)
Summary
↑ SellMoving Avg:
Buy (0)
Sell (12)
Indicators:
Buy (0)
Sell (7)
DAX
17,921.95
-196.37 (-1.08%)
Summary
↑ SellMoving Avg:
Buy (0)
Sell (12)
Indicators:
Buy (1)
Sell (6)
FTSE 100
8,144.13
-2.90 (-0.04%)
Summary
SellMoving Avg:
Buy (5)
Sell (7)
Indicators:
Buy (2)
Sell (4)
Hang Seng
17,763.03
+16.12 (+0.09%)
Summary
↑ SellMoving Avg:
Buy (0)
Sell (12)
Indicators:
Buy (1)
Sell (6)
US Small Cap 2000
1,973.05
-42.98 (-2.13%)
Summary
↑ SellMoving Avg:
Buy (0)
Sell (12)
Indicators:
Buy (0)
Sell (7)
IBEX 35
10,854.40
-246.40 (-2.22%)
Summary
NeutralMoving Avg:
Buy (6)
Sell (6)
Indicators:
Buy (3)
Sell (3)
BASF SE NA O.N.
49.155
+0.100 (+0.20%)
Summary
↑ SellMoving Avg:
Buy (0)
Sell (12)
Indicators:
Buy (1)
Sell (7)
Bayer AG NA
27.35
-0.24 (-0.87%)
Summary
↑ SellMoving Avg:
Buy (0)
Sell (12)
Indicators:
Buy (0)
Sell (8)
Allianz SE VNA O.N.
266.60
+0.30 (+0.11%)
Summary
↑ SellMoving Avg:
Buy (0)
Sell (12)
Indicators:
Buy (3)
Sell (5)
Adidas AG
226.40
-5.90 (-2.54%)
Summary
↑ SellMoving Avg:
Buy (0)
Sell (12)
Indicators:
Buy (2)
Sell (7)
Deutsche Lufthansa AG
6.714
-0.028 (-0.42%)
Summary
NeutralMoving Avg:
Buy (3)
Sell (9)
Indicators:
Buy (9)
Sell (1)
Siemens AG Class N
175.90
-1.74 (-0.98%)
Summary
↑ SellMoving Avg:
Buy (0)
Sell (12)
Indicators:
Buy (0)
Sell (9)
Deutsche Bank AG
15.010
-0.094 (-0.62%)
Summary
NeutralMoving Avg:
Buy (4)
Sell (8)
Indicators:
Buy (6)
Sell (2)
| EUR/USD | 1.0658 | ↑ Sell | |||
| GBP/USD | 1.2475 | ↑ Sell | |||
| USD/JPY | 157.91 | ↑ Buy | |||
| AUD/USD | 0.6469 | Neutral | |||
| USD/CAD | 1.3780 | ↑ Buy | |||
| EUR/JPY | 168.32 | ↑ Buy | |||
| EUR/CHF | 0.9808 | Neutral |
| Gold | 2,295.80 | ↑ Sell | |||
| Silver | 26.677 | ↑ Sell | |||
| Copper | 4.5305 | ↑ Buy | |||
| Crude Oil WTI | 81.14 | ↑ Sell | |||
| Brent Oil | 85.62 | ↑ Sell | |||
| Natural Gas | 1.946 | ↑ Sell | |||
| US Coffee C | 213.73 | ↑ Sell |
| Euro Stoxx 50 | 4,920.55 | ↑ Sell | |||
| S&P 500 | 5,035.69 | ↑ Sell | |||
| DAX | 17,921.95 | ↑ Sell | |||
| FTSE 100 | 8,144.13 | Sell | |||
| Hang Seng | 17,763.03 | ↑ Sell | |||
| Small Cap 2000 | 1,973.05 | ↑ Sell | |||
| IBEX 35 | 10,854.40 | Neutral |
| BASF | 49.155 | ↑ Sell | |||
| Bayer | 27.35 | ↑ Sell | |||
| Allianz | 266.60 | ↑ Sell | |||
| Adidas | 226.40 | ↑ Sell | |||
| Lufthansa | 6.714 | Neutral | |||
| Siemens AG | 175.90 | ↑ Sell | |||
| Deutsche Bank AG | 15.010 | Neutral |
| Mua/Bán 1 chỉ SJC # So hôm qua # Chênh TG | |
|---|---|
| SJC Eximbank | 8,300/ 8,500 (8,300/ 8,500) # 1,298 |
| SJC 1L, 10L, 1KG | 8,300/ 8,520 (0/ 0) # 1,510 |
| SJC 1c, 2c, 5c | 7,380/ 7,550 (0/ 0) # 540 |
| SJC 0,5c | 7,380/ 7,560 (0/ 0) # 550 |
| SJC 99,99% | 7,370/ 7,470 (0/ 0) # 460 |
| SJC 99% | 7,196/ 7,396 (0/ 0) # 386 |
| Cập nhật 01-05-2024 10:45:19 | |
| Xem lịch sử giá vàng SJC: nhấn đây! | |
| ↀ Giá vàng thế giới | ||
|---|---|---|
| $2,285.72 | -47.5 | -2.04% |
| ʘ Giá bán lẻ xăng dầu | ||
|---|---|---|
| Sản phẩm | Vùng 1 | Vùng 2 |
| RON 95-V | 25.440 | 25.940 |
| RON 95-III | 24.910 | 25.400 |
| E5 RON 92-II | 23.910 | 24.380 |
| DO 0.05S | 20.710 | 21.120 |
| DO 0,001S-V | 21.320 | 21.740 |
| Dầu hỏa 2-K | 20.680 | 21.090 |
| ↂ Giá dầu thô thế giới | |||
|---|---|---|---|
| WTI | $80.83 | +3.39 | 0.04% |
| Brent | $85.50 | +3.86 | 0.05% |
| $ Tỷ giá Vietcombank | ||
|---|---|---|
| Ngoại tệ | Mua vào | Bán ra |
| USD | 25.088,00 | 25.458,00 |
| EUR | 26.475,36 | 27.949,19 |
| GBP | 30.873,52 | 32.211,36 |
| JPY | 156,74 | 166,02 |
| KRW | 15,92 | 19,31 |
| Cập nhật lúc 10:45:15 01/05/2024 Xem bảng tỷ giá hối đoái | ||

